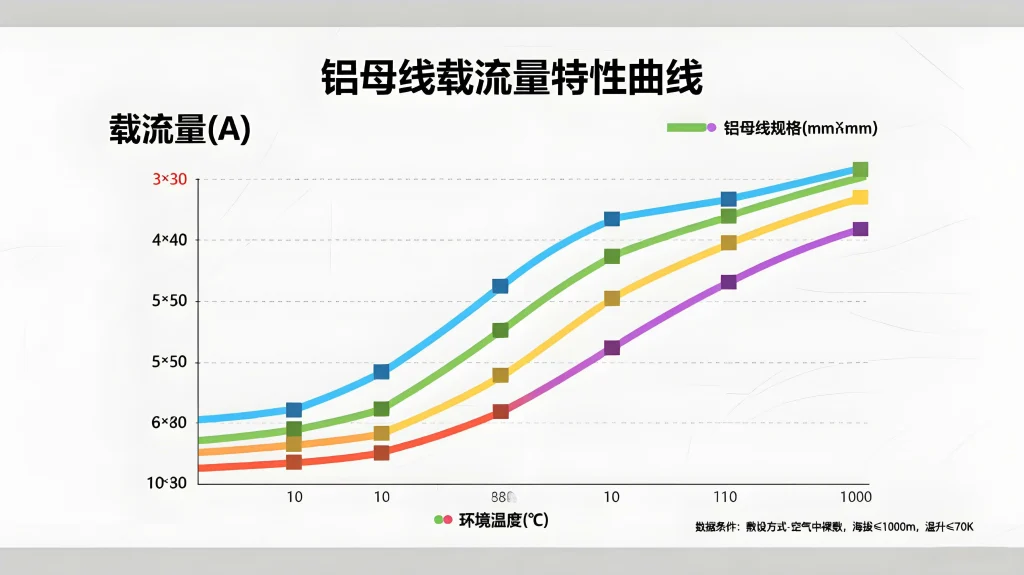
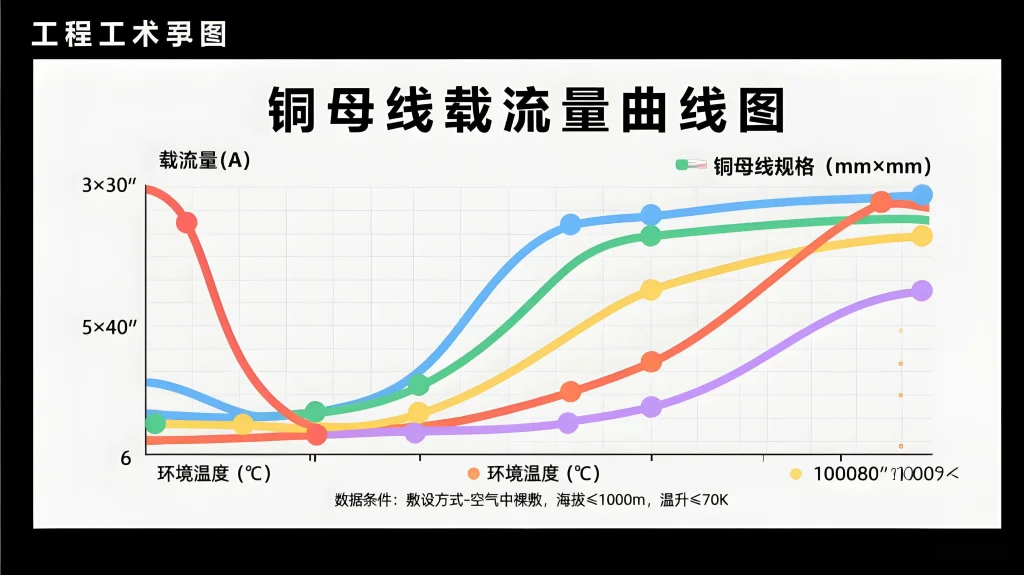
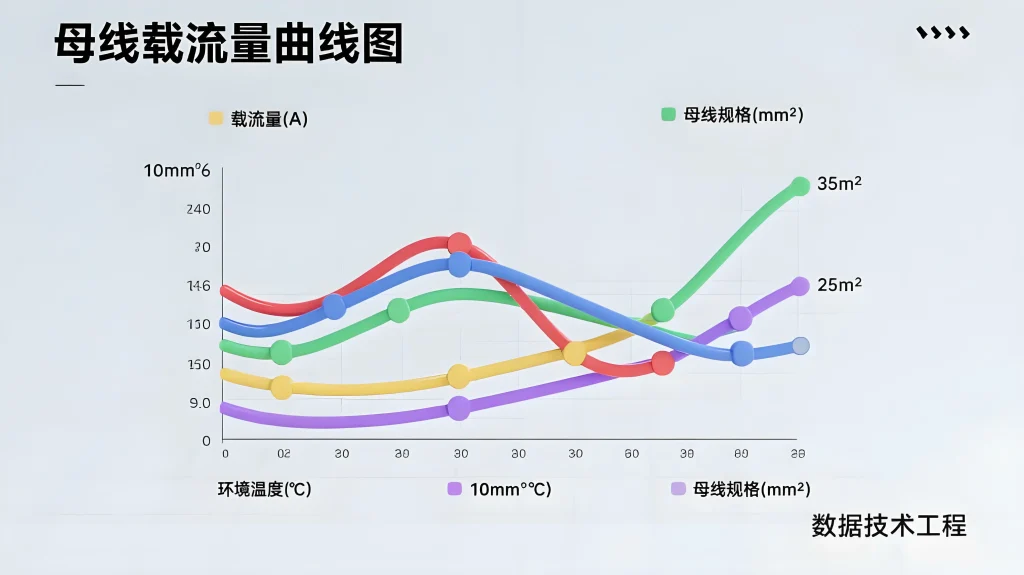
1.Busbar Ampacity Charts Explained | Copper & Aluminum Busbar Sizing Guide – Welleshaft
Understanding Busbar Ampacity Charts is essential for engineers, electricians, and panel designers working with copper and aluminum busbars. These charts provide quick insights into how much current a busbar can safely carry, whether for AC or DC applications. However, interpreting an ampacity chart requires more than reading numbers—it involves assessing physical performance, heat dissipation, and application-specific variables.
At Welleshaft, we help professionals navigate the complexities of busbar sizing by offering tools, testing, and expert guidance to ensure your system meets both electrical and thermal performance requirements
2.What Is an Ampacity Chart?
The term ampacity combines “ampere” and “capacity,” referring to the maximum current a conductor can carry without exceeding its temperature limit.
An ampacity chart (or ampacity table) gives engineers a convenient way to find:
- Maximum current ratingsfor various busbar thicknesses
- Resistance per footat standard temperatures
- Expected heat risefor specific currents
Instead of manually calculating resistance or heat rise, these charts simplify the design process and ensure compliance with standards like NEC o IS.
If you are just starting, here’s the ampacity of copper bus bar explained for beginners: Busbar Ampacity Charts show how many amps a particular busbar size (in square inches or circular mils) can carry under specific conditions.
3.How to Use an Ampacity Chart for Copper and Aluminum Busbars
To determine the correct bus bar standard size:
- Identify the required amperageyour conductor must carry.
- Choose the type of current: AC or DC.
- Select the material: copper or aluminum.
Use the chart to compare thickness, width, resistance per foot, and estimated heat rise. For example:
| Bus Bar Size (inches) | Material | Area (sq. in) | Resistance (MicroOhms/ft) | Ampacity @ 30°C Rise (A) | Heat Rise @ 100A (C) |
| 1/16 x 1/2 | Copper | 0.0312 | 264 | 100 | 38 |
| 1/8 x 1 | Aluminum | 0.1250 | 133 | 136 | 42 |
This method helps engineers perform bus bar sizing without relying on trial-and-error. Use a bus bar calculator for more precision in thermal modeling.

4.AC vs DC: What’s the Difference?
(1)Difference Between DC Ampacity Chart and AC Ampacity Chart
DC systems are more affected by voltage drop due to resistance per foot. Refer to a dc ampacity chart for battery bank designs to estimate power loss over distance.
AC systems must account for heat rise y skin effect due to the alternating nature of current. Use an ac ampacity chart to assess temperature effects in 50Hz or 60Hz systems.
1.AC Ampacity Chart Tutorial With Copper Wire Examples
In AC power distribution, especially with copper, heat rise is a primary concern. An ac ampacity chart tutorial with copper wire examples can guide you in selecting the right copper busbar size and current rating for your equipment.
DC Ampacity Chart for Battery Applications
In DC systems, such as solar or telecom, long-distance runs require attention to dc resistance. The ampacity chart dc section will show microOhms/ft and how that resistance affects the output voltage.
5.Circular Mils vs Square Inches in Ampacity Charts
Ampacity tables often reference both square inches y circular mils:
- Circular milsare used in traditional ampacity copper wire
- Busbars, being flat, are measured in square inches but are converted to circular mils for legacy compatibility.
Example: A 1/16 x 1/2 inch copper bus bar has an area of 0.0312 in² o 39.7 circular mils.
For electrical engineering students, an aluminum bus bar sizing guide using both units provides a clearer understanding of conductor equivalence.
6.Understanding the Skin Effect
What Is Skin Effect Ratio?
- Occurs only in AC power
- Causes current to flow near the surfaceof the conductor.
- Increases resistancewith higher frequency.
A higher skin effect ratio = greater resistance, particularly in high-frequency AC systems.
This phenomenon contributes to the technical comparison of copper vs aluminum busbar ampacity, where copper generally performs better due to its conductivity.
7.What Ampacity Charts Don’t Tell You
Ampacity charts are valuable tools, but some critical factors are not included:
(1)Work Hardened Metal
Copper and aluminum become less conductive when mechanically altered (e.g., bent, punched). This work hardening increases resistance, which ampacity charts don’t account for.
(2)Mutual Proximity & Chimney Effect
- Tightly packed busbarsblock air circulation and reduce cooling efficiency.
- Vertical mounting(chimney effect) improves heat dissipation.
When selecting aluminum busbars o bus bar aluminum for HVAC panels, take convection into account.
(3)Physical Performance Testing
Even with accurate charts and modeling, real-world testing remains essential. At Welleshaft, we offer complete thermal and voltage performance analysis to verify your design.

8.People Also Ask
(1)What is the difference between ampacity of copper and aluminum busbars?
Copper has higher conductivity and ampacity than aluminum. Yet aluminum bus bars are cost-efficient and lighter, ideal for space-constrained designs.
(2)How do I calculate ampacity using a bus bar calculator?
Use a bus bar calculator to input conductor dimensions, temperature, and material to estimate ampacity accurately.
(3)Which is better: ampacity copper wire vs aluminum wire?
Ampacity copper wire carries more current, but aluminum is more affordable and often used in large-scale installations.
(4)What’s the difference between bus bar standard size vs calculated size?
Standard sizes are industry norms, but calculated sizes are based on system-specific thermal, spatial, and load requirements.
(5)Are aluminum busbars suitable for HVAC systems?
Yes. Refer to ampacity chart aluminum wire for HVAC systems to select proper busbar dimensions and material.
9.Conclusion: Use Ampacity Charts with Caution
Whether you’re selecting aluminum bus bar, comparing copper busbar size and current rating, or referencing an ampacity chart aluminum wire, always supplement chart data with real-world testing and layout-specific considerations.
Use tools like ampacity charts, dc ampacity chart, ac ampacity chart, and a bus bar calculator for better planning.
For help with busbar sizing, thermal testing, and regulatory compliance, Welleshaft provides end-to-end support.
Ready to optimize your system? Contact Welleshaft to ensure your busbars perform exactly as expected.

